Your Engineering Questions, Answered Instantly with AI Engineering Insights.
With GitRevio's Live AI Chat, you don't have to search around complicated dashboards. Simply ask questions regarding your work, and you'll receive AI engineering insights with concise responses in a matter of seconds — no unnecessary information, just precise insights when you need them.
Understand Complex Engineering Data — Fast.
Stop wasting time switching between different tools. GitRevio Live AI Chat is an intelligent assistant built for engineering teams. It turns raw activity into clear answers, summaries, and recommendations.
Instead of reading spreadsheets or dashboards, teams use natural language to access AI-driven engineering reports instantly. No technical skills required.
Ask a Question
Just type your question — no technical commands, no complications.
AI Understands Your Data
AI understands your data and history to generate personalized AI engineering insights.
Get Clear Answers
Receive immediate insights and useful reports with summaries in seconds.
Why AI Chat Beats Engineering Dashboards
Dashboards show you what someone has pre-decided you might want to see. They can't answer the question you have right now — the one that just came up in your 1:1, the one your VP asked in the exec meeting, the one that's nagging you at 10pm.
Gitrevio's AI chat handles the long tail of questions that dashboards never will. It correlates data across systems, reasons about cause and effect, and adapts to your team's specific context. GitRevio gives you engineering decision insights on demand.
You still get structured views when you need them. The chat renders interactive charts and data grids right in the conversation. The best of both worlds — the flexibility of natural language with the precision of data visualization.
Dashboard:
Sprint velocity: 42 SP
Cycle time: 4.2 days
PR throughput: 23/week
Now what?
Chat:
"Your velocity dropped 15% this sprint.
The main driver was 3 PRs stuck in
review for 4+ days — all assigned to
the same reviewer who was on PTO.
Redistributing reviews across Sarah
and Tom would have saved ~12 SP."
[📊 Velocity chart] [📋 Stuck PRs table]
{
"mcpServers": {
"gitrevio": {
"command": "npx",
"args": ["gitrevio-mcp"],
"env": {
"GITREVIO_API_KEY": "gr_..."
}
}
}
}
# Then in Claude:
> Analyze our sprint velocity trend and tell me
> why the mobile team is slowing down
Like Talking to Your Best-Informed Team Lead
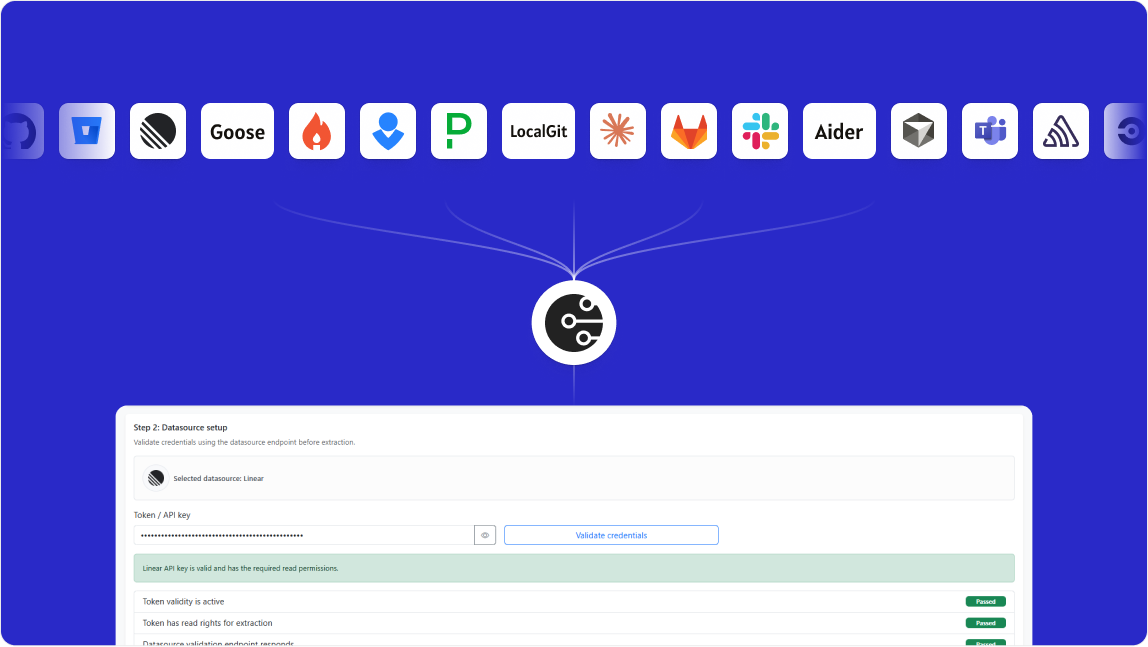
Gitrevio's AI chat connects to every data source in your stack — GitHub, GitLab, Jira, Linear, time tracking — and reasons across all of them at once.
It doesn't just repeat numbers back to you. It identifies root causes, correlates signals across systems, and suggests next steps. Ask a follow-up to go deeper.
Answers are grounded in your data, with provenance markers showing which sources informed each response.
No training required. If you can ask the question in a Slack message, you can ask it in Gitrevio.
Real Answers, Straight from Real Engineering Data
Live AI Chat plugs right into your existing tools and workflows. You get insights straight from your real data — without any vague guesses. Every answer from facts you can trust.


Ask Gitrevio About Anything. 100+ Questions Across Four Dimensions.
Our AI is pre-trained on the questions engineering leaders actually ask. Not generic analytics — the specific, nuanced questions that drive decisions.
People
- Who are our attrition risks, and what signals are triggering?
- How is the new hire on the platform team ramping compared to baseline?
- What happens to delivery capacity if we lose our most senior backend dev?
- Which engineers are showing signs of burnout?
Process
- Why are our sprint completion rates declining?
- Where are the review bottlenecks forming this week?
- How does our cycle time compare to 90 days ago?
- Which teams are over-committing and which are sandbagging?
- What's the realistic timeline for the auth rewrite? Show me p50/p75/p90.
- Why did our review time spike? Break down the causes.
Code
- Where is tech debt accumulating fastest?
- Which repos have the highest change-failure rate?
- What's the quality difference between AI-assisted and hand-written code?
- Show me the files with the worst knowledge concentration.
Business
- What's the fully-loaded cost of the payments rewrite?
- How would adding two engineers to mobile affect the Q3 roadmap?
- Generate a board-ready engineering health summary.
- Are we spending more time on maintenance or new features this quarter?
Why teams use live AI chat
GitRevio puts all your data in one place, on one easy-to-read dashboard, so you always know what's happening.
Teams choose GitRevio because it helps them:
→Save time on reporting
→Reduce manual admin work
→Make faster decisions
→Understand priorities instantly
→Improve delivery confidence
→Access AI engineering insights anytime
Get answers without doing the work manually
Live AI Chat converts engineering activity into clear insights, so you don't need to search, sort, or filter any data yourself.
Use AI-driven engineering reports to understand:
→Progress
→Delivery risk
→Workload
→Productivity trends
→Team performance
Answers with Charts, Tables, and Drill-Downs
Gitrevio's chat doesn't just return text. Ask for a velocity trend and get an interactive chart. Ask for a team comparison and get a sortable data grid. Ask for attrition risks and get a table you can filter, export, and share.
> Show me velocity trend for all teams, last 6 sprints
# Interactive chart (AG Charts)
# Drill down: click any team for sprint detail
# Export: CSV, PNG, or share link
> List all PRs in review for more than 48 hours
# Sortable data grid (AG Grid)
# Sort, filter, group by column
# Click PR number to open in GitHub
Built on AG Charts and AG Grid. Interactive charts render velocity trends, burndown curves, health score breakdowns, and activity distributions. Data grids give you sortable, filterable tables for PRs, contributors, sprints, and alerts — with inline links back to GitHub, Jira, or Linear.
The AI decides the best format for each answer. A trend question gets a line chart. A list question gets a data grid. A single-number question gets a direct answer with context. You don't choose the visualization — the answer does.
Our Chat and Yours
Gitrevio has its own full-featured chat with rich output — charts, grids, drill-downs. But it also integrates into the tools you already use, so you never have to leave your workflow.
Gitrevio Chat
Full-featured web interface with interactive AG Charts, sortable AG Grid tables, conversation history, and shareable threads. The richest experience — charts you can hover, tables you can filter, answers you can drill into.
Slack & Teams
Type /gitrevio in any channel or DM the bot directly. Get answers inline — no context switching. Thread-aware follow-ups. Condensed output optimized for messaging.
MCP (Claude,
Cursor, Windsurf)
Connect via our MCP server. Your AI coding tool gets full access to engineering intelligence — 21 tools, 50+ prompts, and structured data it can reason about.
API
Programmatic access to every query the chat can answer. Build intelligence into your own tools, dashboards, or agentic workflows.
Frequently Asked Questions
Gitrevio Live AI Chat turns engineering data into instant answers and AI engineering insights.
It pulls together information from all your connected data sources, checks the context, and gives you insights and summaries that actually fit your query.
No. Both technical and non-technical persons can use it. You can ask questions in plain language.
Most answers are generated in seconds.
You can ask about project progress, risks, sprint delays, team workload, code quality, tasks, capacity planning, and weekly changes.
Yes. It is useful for engineering leaders, managers, and teams.
No. It is designed for quick adoption and simple use.
Because answers are faster, simpler, and easier to access.
Yes. It can offer insights for teams and projects simultaneously.
Yes. It helps monitor priorities and progress quickly.